Data Warehouse and Dimensional Data Modeling
In my previous Data Modeling — Basics blog, we discussed about how an organization collects the data, which is, operational data (everyday transactions/business processes) through database systems and utilize data modeling to create a well defined structure and how it is specifically designed for OLTP (Transactional) workloads.
Let’s imagine an operational database as a Teacher, whose main objective is to give out information and educate students (transactions), at the same time answer to the questions students might have (analytical queries). This is exactly how an OLTP database works but now if the number of queries start increasing during a lecture, it can be said that there would be a lot of overload on the teacher resulting in delayed response, interruption of lectures and overall an inefficient process.
Now, if we could collect all the queries from the students and make a pattern to ask from the lecturer without overloading or interrupting the teacher, it would have so much benefits. This is exactly what a data warehouse attempts to solve where, we collect data from all the sources and aggregate it and store it in one place, which can then be used for queries, gaining insights, build intelligence, enable data-driven decision making. The data warehouse is decoupled from database systems, in most cases.
Now similar to any technology, data warehouses, have also evolved over the years to data lakes, data lakehouses, cloud data warehouse and such. They all build on top of data warehousing and it is crucial to understand why this data warehousing concept exists and its quirks. In the next couple of blogs, we will discuss more advanced, recent data architectures.
AData warehouse is a centralized data repository that aggregates, stores, and processes large amounts of data from multiple sources. It separates the data analysis workload from the standard transaction workload of a regular database management system. This form of database, known as Online Analytical Processing (OLAP), enables users to interactively analyze data by posing queries.
There are four key characteristics of a data warehouse.
- Subject-oriented — When building a data warehouse, you should have in mind one or more subject areas to explore, meaning what business process you want to store and analyze. It makes it is easier to store all the relevant data related to a subject in the data warehouse.
- Integrated — A data warehouse achieves integration by consolidating information from diverse sources, ensuring uniformity in data format. The integrated data also addresses challenges like name clashes and variations in data types, promoting a cohesive and standardized representation.
- Non-volatile — Non-volatile means data should not be deleted once it’s loaded to the data warehouse. The purpose of a data warehouse is to analyze data as it exists. The more data you have, the better the results of your analysis.
- Time-variant — A data warehouse aggregates data over a long period so that it can measure changes in data over time. This helps users to discover trends, patterns, and relationships between data elements.
A data warehouse typically deals with structured data, which is organized for a specific purpose, facilitating easier insights and answers to targeted questions.
In contrast, semi-structured data, exemplified by an email message, is only partially organized. While it contains structured elements like sender and subject, the body remains unstructured and may encompass various data types such as text, images, and videos.
Unstructured data, on the other hand, doesn’t conform to a predefined data model and can encompass diverse forms like text, video, or audio. Collecting and storing unstructured data doesn’t adhere to a specific data model, but its analysis demands sophisticated mechanisms like machine learning and data mining.
How does a data warehouse look like? Data Warehouse Architecture?
Creating a data warehouse setup involves making sure it can handle data coming in from different places. The main goal is to process this data and organize it in a consistent way. This organized setup lets people look into the data and find useful insights. Important parts of a data warehouse setup include where the data comes from, a space for processing the data first, the main data warehouse, and specific data sections called data marts. All these parts work together to smoothly bring in, organize, and analyze data, helping people discover important things from the stored information.

Let’s talk about each of the elements.
- Data Sources — The first part of a data warehouse setup is where the data comes from, and it’s super important for finding useful insights. These sources can be external, like online surveys and social media. They can also be internal, like info from the company database about customers and products. Other types of data come from everyday business activities, such as customer orders, and from files that might not have a clear structure but still hold important info, like customer details or online behavior. Making sure all this data is accurate is really important to avoid using wrong or not-so-good data for analysis.
- Data Staging — The next component is data staging, the data staging area includes a set of processes known as the ETL or extract, transform and load pipeline. Data staging acts as a transitional area where data undergoes necessary preparations before being moved to the main data warehouse. It ensures that the data warehouse contains high-quality, consistent, and well-organized data. Since raw data is not ready for analysis, it does so by cleaning, transforming, and organizing raw data from various sources into a format that is suitable for analysis.
- Data Warehouse — Think of the data storage part in a data warehouse like a big storage room for information. This storage room uses something called relational databases to keep everything organized. But these relational tables follow Dimensional Modeling, which we will discuss later in the article. Inside this room, there’s also a special list called metadata. This list has important details about the data, like where it came from, what it includes, and where it’s kept in the databases. You can think of metadata as a table of contents for all the stored data, helping the people in charge keep track of things and make sure everything is working smoothly.
- Data Marts — Data marts are smaller, specialized subsets of a data warehouse that focus on specific business functions or departments within an organization. They are designed to store and manage data related to a particular area of business, such as sales, marketing, finance, or human resources. Data marts are essentially mini-data warehouses that cater to the specific needs of a particular group or team. By focusing on specific business areas, they enhance performance, cater to the needs of individual business units, and facilitate more effective data analysis for decision-making.
- Data Analytics — Users can leverage various techniques to perform data analytics and derive insights from the data stored in a data warehouse such as SQL queries, Statistical Analysis, Machine Learning, Data Mining, Time series analysis, etc. The choice of technique depends on the specific goals of the analysis and the nature of the data. Often, a combination of these techniques is employed to gain a comprehensive understanding of the information stored in the data warehouse.
- Data Presentation — In order to create actionable business value, it is important to present the insights with business stakeholders. Presenting and reporting data for business intelligence using a data warehouse involves creating clear, insightful, and actionable visualizations and reports.
One must ensure a complete separation between the analytical operations and the day-to-day transactional operations.
ETL (Extract, Transform, Load) is like a trio of tasks that get data from various places, change it into a format that works well, and then put it into a storage space called a data warehouse. This warehouse is where we keep data for analysis. Now, there are other processes also that are getting traction because of some of the drawbacks of ETL processes, which is a discussion for another article.
Building and managing a data warehouse involves a team effort. Different people, like data engineers, analysts, business folks, testers, and managers, all play a role. Together, they make sure the data is handled properly and is ready for analysis.

ETL will be discussed in detail in another article.
Why was there a need for Dimensional Data Modeling?
A relational model captures a business solution for how part of the business works, while dimensional model captures the details of the business needs to answer questions about how well the business is doing.
The need for dimensional data modeling in data warehouses arises from the distinct requirements of analytical processing, which is different from transactional processing.
- Optimized for Query Performance — Transactional databases are designed for day-to-day operations, focusing on efficient and reliable data processing for transactions (e.g., inserting, updating, deleting records). Data warehouses are optimized for analytical queries that involve aggregations, summarizations, and reporting. Dimensional models use star or snowflake schema structures that make querying large volumes of data more efficient.
- Aggregation and Summarization — Transactional databases focus on detailed and real-time data capture, making it less convenient for tasks that involve aggregating or summarizing data over time. Dimensional models facilitate the aggregation and summarization of data at different levels, enabling users to analyze trends and patterns over time.
- Historical Analysis — Transactional databases are designed to capture the current state of data, and historical analysis can be challenging without additional complexity. Dimensional models often include techniques like slowly changing dimensions (SCD) to track changes over time, supporting historical analysis and trend identification.
The whole purpose of creating a data warehouse was to separate two typical workloads i.e, OLTP and OLAP such that there is minimal impact on real time transactional databases because of heavy analytical workloads.
When working with a data warehouse or data analytics, one needs a data structure or model that can optimize data read/access and queries for specific analysis whether it be Machine Learning, Ad hoc analysis, Reporting, etc.
A dimensional data model is a data model based on the two-key concepts of dimensions and facts.
- Facts — Imagine facts as the things you’re interested in, such as sales, quantities, or prices. These facts are typically numeric and represent measurable values. The important numbers or data you want to look at. For example, the total sales amount for a product or the number of units sold. There are two kinds of measures in the fact table: stored measures and calculated measures. Stored measures are aggregated measures stored in the data warehouse like sales data and product price. This data is loaded from the data source and stored in the database warehouse repository. Calculated measures are calculated from other measures, based on a business process or a calculation rule between several stored measures.
- Dimensions — In dimensional data modeling, dimensions are like the ways we want to look at our data — they’re the categories or aspects that we care about. They’re like the “what,” “when,” and “where” of the information we’re looking at. They help us slice and dice our data to get a clearer picture of what’s happening. Imagine you have information about sales. One dimension could be “time,” so you can see sales data over different periods. Another dimension might be “products,” so you can see how different items are selling. These dimensions help organize and make sense of the data, allowing you to analyze it from different perspectives. In simple terms, dimensions are like the different angles or viewpoints you can use to understand and explore your data.
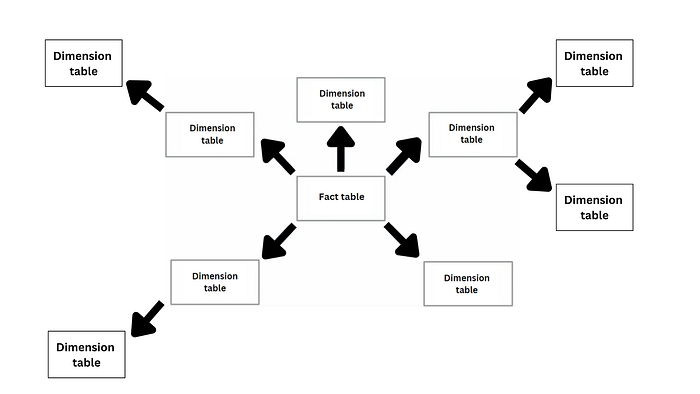
Star Schema — One of the most widely used schemas in a data warehouse is the star schema. The star schema is a common model for designing databases in a data warehouse.
Picture it as a star: in the middle, you have your main facts or data, like sales numbers, prices. These are connected to different categories or dimensions around the edges, such as the product sold, the time of sale, and the location. It’s like putting the important data in the center and connecting it to the details that help explain what’s going on. This way, it’s easy to see and understand the relationships between different pieces of information.

Snowflake Schema — There’s another way to organize your data called the “snowflake schema.” Imagine it like a snowflake because the diagram looks a bit like one.
Now, in this snowflake setup, we try to organize things really neatly to avoid repeating the same information. It’s like keeping things tidy in different boxes.
But, there’s a trade-off. This neatness means we end up with more boxes (or tables) and it takes a bit more effort to connect them when we want to look at the big picture. So, while it keeps things organized, it can make some tasks a bit more complicated. So, in simple terms, the snowflake schema is like organizing your data very neatly into different boxes, but it might take a bit more work to connect the dots when you’re analyzing it.
But how do you build a dimensional data model?
The process for building a dimensional data model revolves around four key steps known as Kimball’s dimensional data modeling.
The model is created using a systematic approach that revolves around four steps. These steps include:
- The business processes — First, decide which part of your business you want to look into. For example, if you’re running a store, you might choose the process of tracking sales.
- The grain (Level of Detail) — Once you know your process, figure out how much detail you need. This is called the “grain.” In our store example, it’s like deciding if you want to look at daily sales or maybe just monthly totals.
- The dimensions — Now, think about the different aspects you want to consider. These are your “dimensions.” For the store, it could be things like products, time, and locations. It’s like deciding if you want to know which products sell the most in each store.
- The facts — Lastly, figure out what you want to measure. These are your “facts.” In our store example, it might be the number of items sold or the total sales amount. These are the numbers you’ll put in your model.
So, to sum it up, you start by picking a business area, then decide how detailed you want to get, think about different angles (dimensions), and finally, choose what specific things you want to measure (facts). It’s a step-by-step process to help you understand and analyze your business better.
Next we will build a dimensional model from scratch because theory without practice is not a good practice.